EQASCOM Pulseguide Monitor Tutorial
This document will attempt to
explain how EQMOD plots Pulseguide events on the Pulseguide Monitor
Screen and how to interpret these plots in order to maximimize the
performance of your autoguiding/pulseguiding setup.
EQMOD receives ASCOM pulseguide command events from the controlling autoguiding software with two basic parameters;
* The direction of correction EAST, WEST, NORT, and SOUTH.
* and the duration of the correction (in milliseconds)
Refering to the screen shot of EQMOD's ASCOM Pulseguide Monitor (Figure
1), there you will see two graphs. The first graph is a plot of
Pulseguide commands issued to EQMOD on the East and West side (RA
Corrections). The second graph is plot area for pulseguide corrections
for North and South side. (DEC Corrections)
FIGURE 1: Screen shot of EQMOD's ASCOM Pulseguide Monitor
Adjusting the Slider bars
FIGURE 2: Closeup Screen shot of EQMOD's ASCOM Pulseguide Monitor
Looking at the closeup screen shot (Figure 2), the vertical slider bars
at the right side of the graphs allow the users to adjust the
plot's peak to peak display. It does not affect the actual guiding
performance. The horizontal slider bars labeled as "RA Width Gain"
and "DEC Width Gain" adjusts the correction durations as issued
by the autoguiding software in terms of percentage values. A 100%
here means the duration values are processed as is without any changes.
A 50% setting would mean half of the actual submitted correction
duration. At 50% RA Width gain for example, if EQMOD receives a
pulseguide command at the East side with duration of 150
milliseconds, EQMOD will execute an East wise correction with 75
milliseconds.
Interpreting the Pulseguide Monitor Graphs
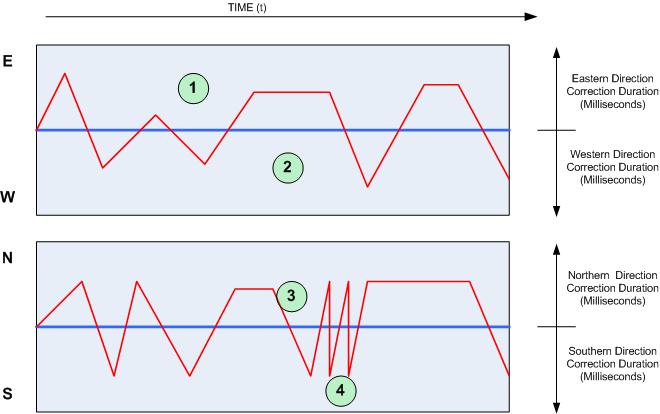
As EQMOD receives a pulseguide
command from the autoguiding software, a plot event is executed. All
East wise correction commands are plotted (figure 3) at the
top side of the first graph (1). West wise events are plotted at
the lower part of the 1st graph (2). North wise correction are plotted
on top part of the second graph (3) and southwise corrections are
plotted on lower part of the second graph (4). The distance from graph
center to the plotted curves is actually the duration data
in milliseconds of each correction. This means a higher plot peak
value equates a correction with a longer duration. This means that
users should aim for plots at the center of the graph in order to
conclude a good pulseguiding performance.
FIGURE 3: Pulseguide Monitor Plot definitions
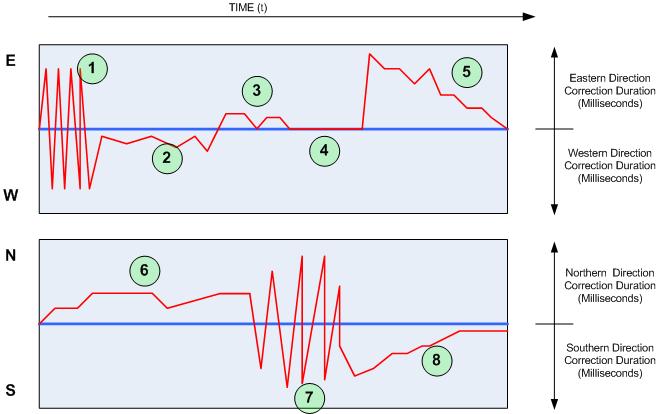
Different Plot possibilities and their respective interpretations
Figure 4 demonstrates different plot possibilites as labeled 1-8 and below is list on how to interpret them;
NOTE:
Autoguiding Calibration should be done at 100% RA/DEC Width gain
settings. Adjustments on the gain values should be done only during the
actual autoguiding process and NOT before any calibration process.
FIGURE 4: Pulseguide Monitor Plot interpretations
 |
-
Pulseguide Oscillations on the RA side. It basically means that there
are correction overshoots. To fix this, user has to lower the RA Width
Gain settings. This has to be done right after an Autoguide Calibration
process.
-
Purely west side corrections. This means that there is a small amount
of RA drift towards the east - may need to RA drift compensate
-
Purely East side corrections. This also means an RA drift towards the west. - May need to RA drift compensate
-
ZERO Duration corrections - MAXIMDL usually issues this kind of
commands. It simply means a correction abort which is perfectly normal
- Eastward
drift correction. - In cases like this, multiple corrections are issued
only on one direction with duration value getting smaller at each
correction instance. It means the duration value issued by the
autoguiding software is very small. User may have to compensate by
increasing RA Width Gain settings.
-
Northside corrections - Succesive corrections on the North side would mean a DEC drift towards the south.
-
Pulseguide Ocillations on the DEC side - Definitely a must to lower the DEC gain settings.
-
Southward Drift Correction - Just like in #(5), user may need to
increase the DEC width gain settings as the autoguiding application is
issuing very small corrections.
#(2),(3),and
(6) (single side corrections) should be ok as long as the fluctations
are very small. Users even induce the drift to boost the performance of
the autoguiding setup.